
ClawCodex /eco: We Measured an 80% Cut in AI Coding-Agent Token Usage
A tool called RTK claims an 80% cut in AI coding-agent token usage from Bash-output compression — but the number is an estimate over a modeled session. We built the same idea into ClawCodex as /eco, then replayed 27 real command outputs through the actual production pipeline to check the math. The headline number holds up. Why it doesn't always hold is the more interesting part.
Executive Summary
Every agentic coding session pays a quiet context-window tax: failing test tracebacks, git ceremony, package-manager progress bars, thousand-line listings. A project called RTK set out to compress that tax and publishes a widely-cited claim of roughly an 80% reduction in Bash tool-output tokens, modeled over a 30-minute Claude Code session. The catch, stated plainly in RTK's own README, is that the number is an estimate for "medium-sized TypeScript/Rust projects," not a measurement.
We ported RTK's compression methods into ClawCodex — our open-source, MIT-licensed Python rebuild of Claude Code — as a session toggle called /eco, then built a small benchmark harness to stop estimating and start counting. Twenty-seven real command outputs (failing test suites seeded with genuine bugs, package installs, git operations, repo-scale listings, a real system log) were replayed through the exact production compression pipeline, and every token was counted with a real tokenizer.
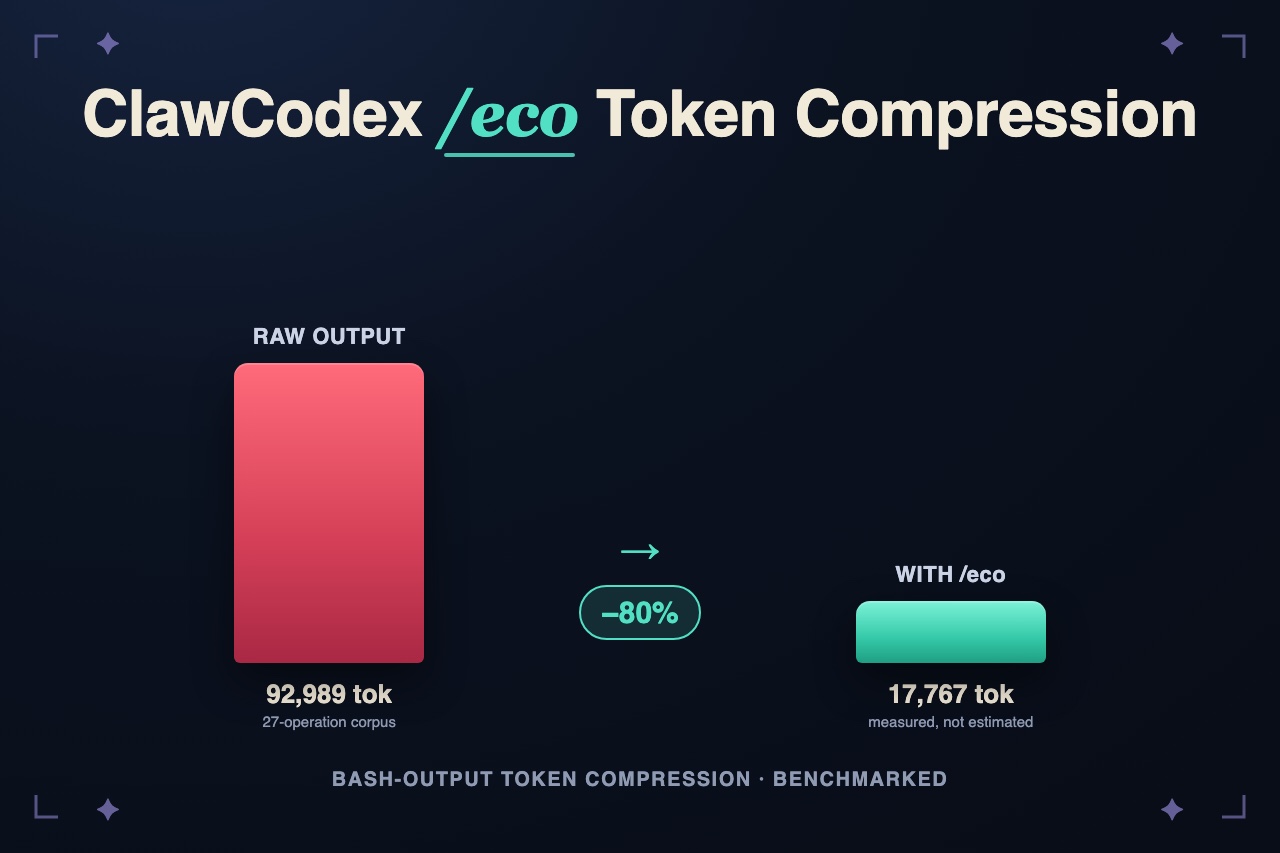
The result: the 80% figure is real, not just plausible. Our corpus measured 92,989 raw tokens down to 17,767 — an 80% reduction. But when we took RTK's own session model and reran it using our measured per-operation ratios instead of their claimed ones, the same modeled session came out to 19%, not 80%. Both numbers are honest. They just answer different questions, and the gap between them is worth understanding before trusting any tool's published compression percentage — including ours.
Introduction
Spend enough hours driving an agentic coding CLI and you start to recognize the same shapes of waste scrolling past: a test runner dumping a 40-line traceback for one assertion, git status printing three lines of hint text nobody reads twice, npm install narrating every package it resolves, a git log or ls -R that hands back a thousand lines when the model needed ten. None of that ceremony helps the model reason about the code. It just occupies context that would otherwise hold your actual problem — and on metered providers, it's billed the same as anything else.
- A failing pytest run where 90% of the traceback is framework boilerplate around one real assertion
- git status printing "(use 'git add <file>...' to update what will be committed)" on every single call
- npm install narrating Collecting / Downloading / Requirement already satisfied for every transitive dependency
- A 2,000-line git log or ls -R when the agent only needed the last few entries
- A system log with 40,000 timestamped lines where 39,950 of them are the same three warnings repeating
A Rust CLI called RTK (rtk-ai/rtk on GitHub) tackles exactly this: it intercepts shell commands before they reach the agent, rewrites them into its own compressed equivalents, and applies the same kind of shape-aware compression across git, test runners, package managers, and logs. Its README is refreshingly specific about the mechanism, and just as refreshingly honest about the limits of its headline number — the published 30-minute-session table is explicitly labeled as an estimate for a certain project profile, not a measurement anyone can reproduce against real output.
That distinction is the entire reason this post exists. We liked RTK's method catalog enough to port it — never-worse guards, failure-focused test summaries, command-scoped ceremony stripping, log deduplication — into ClawCodex as a toggle called /eco. Once it worked, repeating the same claimed numbers felt like the wrong ending. So we built a benchmark instead.
What /eco Actually Does
/eco is a per-session toggle. When it's on, ClawCodex compresses the model-bound rendering of every Bash tool result before it reaches the model — the command that actually runs, its exit code, and the raw stdout/stderr on disk are never touched. Four filter classes cover the shapes above:
- Failure-focused test summaries
- Native pytest, cargo test, go test, and jest output collapses an all-green run to one line and keeps only the failing blocks — kept error lines are never rewritten, only the surrounding ceremony drops.
- Command-family ceremony stripping
- git, pip, npm, cargo, docker, apt, and brew each get a scoped noise filter for their own progress/advice lines (git's "(use 'git add' ...)" hints, npm's Collecting/Downloading spam) — scoped to the command family so an unrelated script printing similar-looking text is never touched.
- Log deduplication
- Large, timestamp-heavy output collapses repeated lines into counts ("[×214] connection reset") after normalizing away timestamps, UUIDs, and paths, with unique errors and warnings kept and ranked by frequency.
- Recoverable head-cap
- Successful output over 400 lines keeps the first 60 and points at the rest with a directly runnable tail -n +N hint, instead of a blind, unrecoverable truncation marker.
> /eco on
eco: on — Bash tool output will be compressed for this session

> pytest
Pytest: 5 failed, 29 passed in 0.04s

1. [FAIL] test_unknown_sku_message
   with pytest.raises(OrderError, match="unknown sku 'gold-bar'"):
   >           o.total()
   ...
[full output: ~/.clawcodex/<ws>/<session>/eco/1707_pytest.log]

> /eco status
eco: on — 12 compressions this session, 8,340 tokens saved (avg -78%)
How We Measured It
Estimating a savings percentage and measuring one are different exercises, so we built eval/eco/ in the clawcodex repo to do the latter. The methodology, in short:
- Captured 27 real command outputs: failing and passing pytest, go test, and jest runs, from small sample projects seeded with genuine bugs (an off-by-one, a wrong error message, an in-place mutation) rather than synthetic placeholder text.
- Added npm and pip installs, git clone/status/commit/push --progress, repo-scale git log/diff/ls/find/cat/grep, a real macOS system log (~35,000 lines), and several must-not-change passthrough cases like a clean git status and docker ps.
- Replayed every capture through the exact production code path — the same truncation logic, the same compression engine, the same function that assembles what actually gets sent to the model — not a reimplementation.
- Counted tokens with a real tokenizer (tiktoken, cl100k_base), not a chars-divided-by-4 estimate.
- Verified the never-worse invariant held with zero violations across the full corpus.
The Results
Raw tokens in, compressed tokens out, measured on real captured output:
| Operation | Raw tokens | /eco tokens | Saved |
|---|---|---|---|
| pytest -v (failing run) | 1,925 | 392 | -79% |
| go test -v (failing run) | 527 | 227 | -56% |
| npx jest (failing run) | 444 | 175 | -60% |
| npm install | 188 | 8 | -95% |
| pip install | 514 | 85 | -83% |
| git clone --progress | 6,868 | 18 | -99% |
| git push --progress | 6,458 | 75 | -98% |
| git status (dirty tree) | 143 | 91 | -36% |
| git log -n 300 | 7,714 | 946 | -87% |
| git diff (large, cross-version) | 7,561 | 748 | -90% |
| ls -R (whole src tree) | 9,088 | 225 | -97% |
| cat (900-line source file) | 6,833 | 552 | -91% |
| grep -rn 'def ' (repo-wide) | 7,582 | 1,219 | -83% |
| log show --last 90s (system log) | 10,512 | 1,977 | -81% |
| Whole 27-operation corpus | 92,989 | 17,767 | -80% |
The corpus is deliberately weighted toward the big, noisy outputs that actually dominate a real session's context spend — failing suites, chatty installs, large listings — alongside eight passthrough cases that (correctly) come back byte-identical. On that mix, the 80% figure holds up as a measurement, not an estimate.
The Honest Catch: Why "-80%" Isn't the Whole Story
RTK's README also publishes an assumed 30-minute-session model: a frequency-weighted mix of operations (ten ls calls, twenty cat calls, four pytest runs, and so on) with an assumed baseline size and a claimed compressed size for each, summing to roughly 118,000 raw tokens compressed to about 23,900 — the same 80% headline. We took that exact session shape and reran it using our own measured compression ratios in place of RTK's claimed ones.
| Operation | Freq | Standard | RTK (claimed) | /eco (measured) |
|---|---|---|---|---|
| ls / tree | 10x | 2,000 | 400 | 2,000 (0%) |
| cat / read | 20x | 40,000 | 12,000 | 40,000 (0%) |
| grep / rg | 8x | 16,000 | 3,200 | 16,000 (0%) |
| git status | 10x | 3,000 | 600 | 1,908 (-36%) |
| git diff | 5x | 10,000 | 2,500 | 10,000 (0%) |
| git log | 5x | 2,500 | 500 | 2,500 (0%) |
| git add/commit/push | 8x | 1,600 | 120 | 1,007 (-37%) |
| cargo test / npm test | 5x | 25,000 | 2,500 | 9,850 (-60%) |
| ruff check | 3x | 3,000 | 600 | 3,000 (0%) |
| pytest | 4x | 8,000 | 800 | 2,320 (-71%) |
| go test | 3x | 6,000 | 600 | 6,000 (0%) |
| docker ps | 3x | 900 | 180 | 900 (0%) |
| Total | ~118,000 | ~23,900 (-80%) | ~95,500 (-19%) |
Under RTK's own averaged assumptions, a results-only compressor lands at roughly -19%, not -80%. The rows where their assumed per-call size is small — a ~2,000-token cat, a ~200-token ls — sit under /eco's size thresholds and pass through completely untouched, contributing 0% instead of -70/-80%, because the never-worse guard means there's simply nothing worth compressing there.
The gap comes down to a design choice. RTK rewrites the command itself into its own CLI — rtk ls, rtk cat, rtk grep — so literally every call, even a tiny ls, goes through the compressor. /eco only compresses results: the command the agent actually wrote is the command that runs, and small or medium output passes through unchanged by design. Real sessions are fat-tailed — one failing 30-test suite, one noisy npm install, one 2,000-line git log burns more context than fifty small ls calls combined. A corpus of real captured operations shows that. An averaged session model hides it.
Why We Built It This Way
Not touching the command has a real cost — it leaves 0% on the table for exactly the operations RTK's rewrite approach compresses. We think it's worth paying for two reasons. First, the command the agent typed stays the command that ran; nothing downstream (logs, session transcripts, a human reviewing the trace later) has to reconcile what the model asked for against a rewritten equivalent. Second, it keeps the blast radius of a bug in the compressor small: a filter that misbehaves can only ever change what the model sees after a command already ran with its original semantics intact, never what the command was in the first place.
Recoverability follows the same logic. Every lossy compression tees its full, uncompressed output to a per-session file and appends a directly runnable pointer (tail -n +61 ... or a plain file path) before it ships — if that file can't be written, the compression is discarded and the raw output ships instead. Pure ceremony (progress bars, advice lines errors could never match) is the one class allowed to skip the tee, because there's genuinely nothing there worth recovering.
The benchmark itself went through the same scrutiny we'd apply to the feature: an adversarial internal review caught two things worth naming, because they're exactly the kind of mistake a benchmark like this can hide. First, an early draft's measurement wasn't fully deterministic — the recovery-hint file path embedded a timestamp, so re-running the harness on an unchanged corpus nudged the token counts by roughly one token per row. We fixed it by pinning the volatile parts of that path so the same corpus now measures byte-identical every time. Second, an early draft of this exact writeup claimed compressed output "stays recoverable" and error lines "survive verbatim" — both slightly too strong, since pure-ceremony drops are never teed and failure blocks are capped rather than unlimited. The phrasing above ("kept error lines are never rewritten," "every lossy compression tees the full output") is the corrected, engine-accurate version.
Try It Yourself
The capture and measurement scripts are stdlib-Python plus tiktoken, committed alongside the results in the clawcodex repo:
python3 eval/eco/capture_corpus.py --workdir /tmp/eco-bench
.venv/bin/python eval/eco/measure.py
The first command builds small sample projects with real seeded bugs and runs the full capture sweep; the second replays the corpus through the production /eco engine and writes a fresh results.md. Point it at your own project's command history and you'll get your own numbers, not ours — which is rather the point of this whole post.
Actionable Tips
- Turn on /eco for noisy sessions: failing test suites, dependency installs, and repo-scale git history are exactly where it earns its keep.
- Treat any published compression percentage — including this one — with a raised eyebrow until you know whether it's measured on real output or extrapolated from an assumed session.
- If a compression tool rewrites your commands, ask what happens to small, already-cheap calls; a results-only approach that passes them through isn't a weaker design, just a different one.
- Publish both numbers when you can: the real corpus measurement and the honest recompute under the competing tool's own assumptions. The gap between them is more informative than either number alone.
- Recoverability is not optional in a compression feature that touches test failures — verify a never-worse guard and a recovery path exist before trusting one in a real workflow.
Conclusion
The 80% figure is real — measured on 27 real command outputs replayed through the exact production pipeline, not projected from an assumed session. It's also not the only honest number: recompute the same claim under RTK's own averaged session model with measured ratios instead of assumed ones, and it lands at 19%, because a results-only compressor leaves small, already-cheap calls untouched by design. Both numbers describe the same feature correctly. Which one is relevant to you depends on whether your sessions look like an average or, like most real ones, a handful of very large outputs surrounded by a lot of small ones.
/eco is on by toggle, ships with a never-worse guard and a recovery path for anything it compresses, and the entire benchmark — corpus, harness, and results — is in the open-source clawcodex repo for anyone to rerun.
References
- ClawCodex on GitHub
- RTK (rtk-ai/rtk) on GitHub — the original token-compression method catalog
- OpenAI tiktoken — the tokenizer used for every measurement in this post